
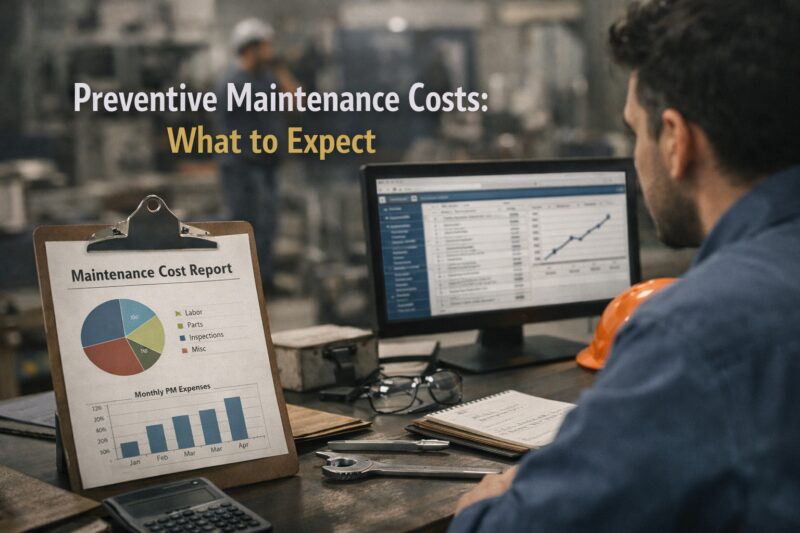
Preventive maintenance costs are the money you spend to keep equipment healthy on a planned schedule. In practice, that means labor, parts, inspections, documentation, and planned downtime where applicable. Your totals vary because asset risk, access difficulty, and how well your maintenance plan fits real-world conditions.
This guide explains what to expect from preventive maintenance budgeting, including the parts of preventive maintenance costs that often surprise people. Use it to forecast spend for 2026 with fewer gaps and better confidence. You will also learn how to avoid common mistakes that quietly inflate the budget.
What preventive maintenance actually costs you, and why it varies
Preventive maintenance costs usually include more than just “doing the checklist.” Most budgets combine technician labor, parts, inspection time, and the paperwork needed to keep records usable. Many plans also include time for planned downtime, mobilization, and testing.
Because every facility runs different equipment, the same calendar interval can create different costs. For example, a pump in a tight mechanical room takes longer than one with easy access. In addition, older assets often require additional inspections because wear shows up in unexpected places.
It matters because your forecast sets staffing and scheduling expectations for the year. When the forecast misses key cost buckets, you end up funding work with emergency labor later. Meanwhile, when you overestimate, you tie up resources that could support other reliability projects.
To keep estimates realistic, separate “preventive work” from “fixing what you find due to breakdowns.” Two sites can spend the same amount and get very different reliability outcomes. One may have strong job discipline and good data. The other may misclassify corrective repairs as preventive.
A common misconception is that preventive maintenance is one standard price. In reality, costs move with risk, complexity, and how your plan is executed. If your job codes and asset history are messy, benchmarking becomes misleading because the categories do not match.
What preventive maintenance costs usually include (and what they don’t)
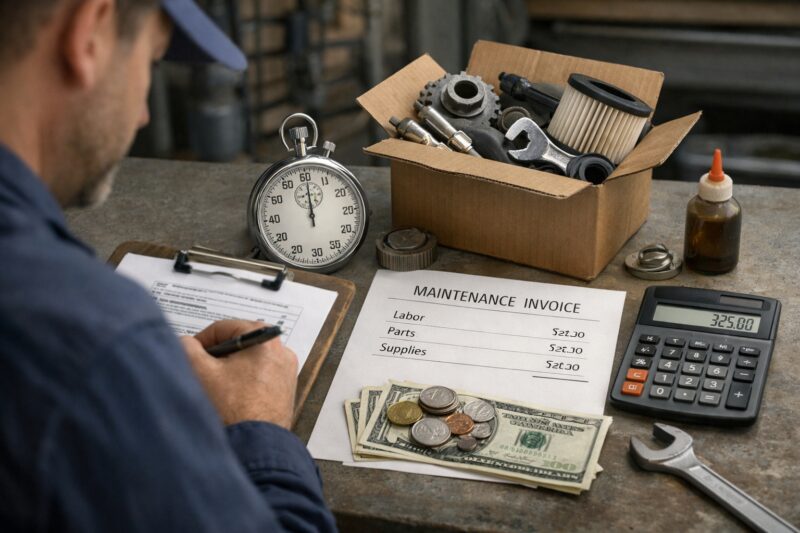
When people budget preventive maintenance, they often miss certain cost components. A complete view typically includes technician time, parts and materials, and inspection or test labor. It also includes diagnostics when you need to confirm a finding before replacing anything.
Many organizations also include documentation and administrative effort. This can mean updating asset records, completing check sheets, and writing service notes that support future planning. If your maintenance management system tracks task history, there is usually time spent ensuring job details are accurate.
However, typical estimates exclude emergency repairs that happen outside the planned scope. They also exclude unrelated projects that might be bundled during a , such as a capital upgrade. In addition, they should not include “downtime cost” estimates unless your work order explicitly accounts for them.
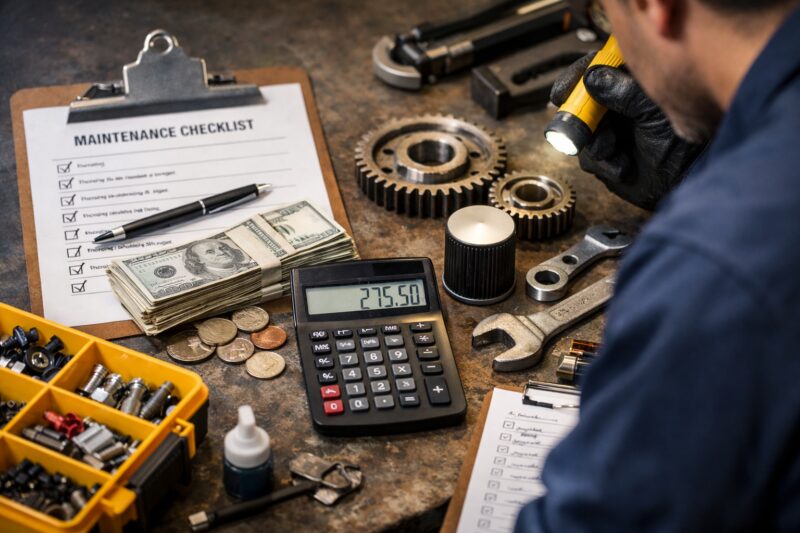
Cost drivers can change estimates even when the schedule stays the same. Asset criticality matters. Higher-risk assets often require tighter tolerances, more verification steps, and stricter sign-off. Access requirements also matter, including permits and safe lockout procedures.
Another nuance is misclassification. Some teams treat discoveries as preventive, even when the underlying issue is corrective. That practice can inflate preventive maintenance costs on paper. It can also mask reliability problems, because the true driver stays buried in the wrong category.
The cost range you should expect: how estimates are formed
Preventive maintenance cost ranges come from inputs and assumptions, not a single universal number. Estimators start with your asset inventory and map maintenance intervals to those assets. Next, they factor expected labor time, expected parts consumption, and testing effort.
Good forecasts use past work history to validate the checklist scope. For example, if historical jobs show longer troubleshooting for a specific model, the estimate should reflect that. Meanwhile, vendor and contractor rates influence total spend, especially when specialized tools or certifications are required.
Scope definition creates a major source of variation. A standard checklist might cover routine inspection and adjustment. Condition-based add-ons expand the scope when certain readings appear, such as abnormal vibration or temperature trends.
Frequency and intensity also trade off. More frequent smaller Services can reduce the chance of failure, yet they increase recurring labor and planned downtime. Less frequent broader shutdown work can reduce visits, but it can also concentrate risk into fewer windows.
Older assets often widen the estimate range. That is because wear creates more findings and sometimes more parts variety. If you only build a one-point estimate, your budget can fall short during heavy-issue quarters.
A practical way to handle uncertainty is to use confidence bands. For example, plan a baseline and a higher scenario for assets that commonly generate findings. Then reserve part of the budget for the normal “unknowns” you see in execution.
A practical decision path for planning preventive maintenance spend
A good planning workflow starts with your inventory. Then you group assets by criticality, because that is how you decide what “must be preventive” versus “can be optimized later.” Next, set maintenance strategy by asset class and risk level.
From there, choose an interval approach. Time-based schedules fit many equipment types, especially when usage varies less. Usage-based approaches use runtime or cycles when that data is stable. Condition-informed planning uses readings and trends, but it requires reliable measurement and consistent documentation.
Then estimate labor and parts for each task. You do this by tying checklist steps to technician effort, tooling needs, and likely consumables. After that, schedule the work around real constraints such as planned outages, permit lead times, and parts availability.
Tradeoffs show up when you try to do everything at once. The “minimum viable preventive plan” idea helps. Start with work you can execute reliably and document consistently. As you gather job results, expand scope and tighten intervals where the data supports it.
For prioritization, focus first on safety and downtime impact. Also prioritize equipment with high failure impact on other systems. Finally, consider maintainability. If access is hard, you may need fewer but more complete visits.
A common mistake is skipping the strategy step and jumping straight to intervals. That creates a plan that looks busy but does not reduce corrective work. Instead, align each task to a known failure mode or a verification goal.
Common misconceptions that inflate or hide preventive maintenance costs
One misconception is that preventive maintenance is always cheaper than breakdowns. Sometimes it is, especially when failures create costly downtime or safety risks. However, poor scope, weak execution, or wrong intervals can waste money without improving reliability.
Another misconception is that more frequent servicing always lowers total cost. In many cases, it increases wear-related handling and raises labor and planned downtime totals. As a result, you may spend more while you still see similar failure rates.
People also misread “average cost per task.” Averages hide variation in access time, test complexity, and parts differences by asset model. Therefore, two tasks that sound similar can require very different execution effort.
Confusion between preventive maintenance and compliance-only inspections is also common. Compliance testing can be part of a reliable maintenance plan, but it does not automatically address wear or degradation mechanisms. If you only do compliance tasks, you might miss the checks that prevent functional failures.
A deeper hidden issue is poor data hygiene. Inaccurate asset runtime leads to wrong intervals. Incomplete job codes make it hard to separate preventive work from corrective repairs. As a result, your preventive maintenance costs can look stable even while reliability worsens.
For teams that want better mechanic execution, planning documentation quality matters. Strong checklists support consistency across visits. Some organizations also add mechanic shop maintenance support to standardize field work and reduce variance.
How to compare options to control preventive maintenance spend without cutting safety margins
You can control preventive maintenance costs without cutting essential safety steps. The key is comparing options by execution quality, not only by hourly rate. Internal teams, contractors, and hybrid models can all deliver reliable results when the scope and data discipline are strong.
Start by comparing technician labor rates and total planning effort. Then compare how each option handles diagnostics, documentation, and checklist fidelity. Also evaluate parts sourcing methods, including standardization and lead-time management.
Risk controls should be part of the comparison. For planned work, look for lockout discipline, verification steps, and clear sign-off procedures. If a contractor can document work consistently, your budget forecast improves because your inputs get better.
Procurement strategy changes ongoing costs too. Keeping larger spares inventories can reduce visit delays, but it increases carrying costs and risk of obsolete parts. Just-in-time sourcing can reduce inventory, but it can inflate job interruptions when lead times slip.
Two plans with the same checklist can still differ in outcome. That is because calibration, inspection rigor, and follow-through affect what gets corrected. Therefore, quality of execution becomes a cost lever when you link inspection findings to timely corrective actions.
Here is a practical comparison table you can use during planning.
| Model | Cost predictability | Data quality | Parts strategy | Risk controls | Best fit |
|---|---|---|---|---|---|
| Internal team only | Medium to high, if labor demand is steady | High when job codes are disciplined | Can be optimized with standard stocking | Strong when training and supervision are consistent | Assets with frequent recurring work |
| Hybrid (internal planning + contractor execution) | High to medium with scoped work orders | High if checklists and reporting are standardized | Depends on contract and lead-time planning | Strong when requirements are built into scope | Mix of in-house knowledge and scale needs |
| Contractor/service provider | Often high with fixed service terms | Varies unless documentation expectations are clear | Usually managed through their procurement process | Good when audit and sign-off rules exist | Complex equipment or surge capacity |
If you are planning vehicle-related maintenance, scope clarity can be especially important. For instance, shops that standardize service documentation tend to produce more consistent estimates. Some fleets also use comprehensive auto repair services to keep records aligned across different service lines.
Advanced considerations when assets, sites, or schedules don’t behave normally
Most maintenance plans assume clean data and predictable access. Many real operations do not. You might have legacy assets with unclear maintenance histories. You might also have long parts lead times or constrained access windows.
For legacy assets, the cost impact comes from uncertainty. You may need extra validation steps early, such as measuring baseline condition or confirming installation specifics. Then you adjust intervals based on what the assets actually do over time.
Sites with constrained access windows change scheduling costs. Mobilization can be higher, because work must be compressed into short windows. Permits and safety staffing can also add cost even when the checklist is unchanged.
Scope variability is another edge case. Allowance can help when the plan includes “open findings” that must be reviewed before repairs. However, too much allowance can hide scope creep. A better approach is to define what qualifies as a normal finding and what triggers a change request.
Data maturity determines how condition-informed maintenance affects preventive maintenance costs. Condition-based approaches require reliable signals and consistent measurement practices. Without that, adding condition checks increases labor without improving targeting.
The performance feedback loop improves forecasts over time. After each cycle, recalibrate intervals and update checklists based on repeat findings. If failures repeat, your preventive tasks may be incomplete or poorly timed.
As an example of consistency practices, some vehicle owners rely on a go kart maintenance checklist to standardize what they inspect each session. The logic is similar in industrial settings: better repeatable checks improve learning and reduce budget drift.
Building a preventive maintenance budget and forecast for 2026 and beyond
Turning a maintenance plan into a 2026 budget starts with converting tasks into annual totals. You account for seasonal work, planned shutdowns, and available staffing capacity. You also factor parts lead times so you do not schedule tasks you cannot support.
A rolling forecast works well when conditions change throughout the year. You can update assumptions based on actual job durations and parts usage. Another method is a historical baseline with adjustments, using prior year spend to guide the next plan.
Scenario planning improves readiness. Build budgets for normal quarters and high-issue quarters. For instance, if certain assets usually generate more findings in summer, you can adjust accordingly.
Tracking planned versus unplanned work matters because it tells you whether preventive spend is working. If preventive tasks are stable but corrective work rises, your preventive strategy may be missing key failure modes. Therefore, you should review job breakdowns and checklist adherence, not only totals.
Budget confidence improves with practical controls. Track job completion rate, adherence to checklist steps, and recurring defect rates. Also watch for recurring findings that do not close. Those signals often point to execution issues rather than interval problems.
Finally, separate routine preventive from lifecycle renewals. Replacing major components is not the same as inspecting and minor adjustments. If you mix them, you can misread how preventive maintenance costs trend and you may create budget shocks.
Frequently Asked Questions About Preventive Maintenance Costs: What to Expect
What should be included in preventive maintenance costs for my budget?
Include technician labor for inspections and planned work, plus parts and materials used during those jobs. Also include test and diagnostics labor when those steps confirm condition. Finally, budget time for documentation so you can maintain accurate maintenance history and job codes.
Exclude emergency repairs, unrelated projects, and corrective work that is not part of the preventive scope. If you track downtime as a cost, only include it when your budgeting model explicitly accounts for planned versus unplanned downtime.
Why do preventive maintenance costs vary so much between facilities?
Costs differ due to asset mix, access complexity, and how critical the equipment is to operations. A facility with difficult access or tight shutdown windows often pays more per visit because execution time and mobilization are higher.
Labor rates and parts sourcing also drive variation. In addition, data quality affects costs because wrong intervals can cause either too many visits or missed targeting.
How do I estimate preventive maintenance costs if I don’t have much maintenance history?
Start with your inventory and choose initial intervals based on equipment guidance and risk. Then use vendor input and early execution results to set realistic labor time for your checklists.
During the first planning cycle, track findings and update assumptions. After you refine interval settings and parts expectations, your 2026 forecast becomes more accurate.
Can cutting preventive maintenance reduce total costs?
It can reduce spend in the short term, but it often shifts cost into corrective repairs and downtime. If you cut scope without addressing the underlying failure modes, you may increase repeat failures and create hidden cost growth.
Make changes only when evidence supports them. Look for fewer recurring findings, fewer corrective events tied to the same components, and acceptable reliability and safety outcomes.
What’s the difference between preventive maintenance and compliance inspections in cost planning?
Compliance inspections focus on meeting regulatory or policy requirements and documenting that checks were done. Preventive maintenance aims to reduce functional failures by addressing wear and degradation with planned tasks.
Compliance work can be part of a preventive plan, but it should not be assumed to fully cover reliability needs. If compliance tasks do not match failure modes, preventive maintenance costs may not control corrective load.
How do condition-based approaches change preventive maintenance costs over time?
Condition-based approaches usually shift spending from fixed-frequency visits to targeted checks driven by readings and trends. That can reduce unnecessary visits once the signals and thresholds are stable.
However, there can be transition costs for instrumentation, data review, and calibration. Over time, costs often move toward higher-quality targeting if your data and job discipline are solid.
What are the most common mistakes that lead to unexpected preventive maintenance expenses?
Many surprises come from incomplete asset lists and wrong interval settings. Another major issue is misclassified work orders, where corrective repairs get logged as preventive.
Poor parts planning also causes delays, expediting, and rework. Finally, budgets often forget allowances for normal findings when teams do not define change triggers or scope boundaries.
Should I use internal staff or outsource preventive maintenance work?
Choose based on capability, continuity of knowledge, and documentation quality. Internal teams can build deep asset understanding, while contractors may add specialized skills and capacity.
A hybrid model often helps when you want consistent planning but need scalable execution. Evaluate each option by scope control, checklist adherence, and how they handle documentation and recurring findings.
How can I forecast preventive maintenance costs for a site with long shutdown lead times?
Plan far ahead by mapping tasks to shutdown windows and accounting for permit and mobilization lead times. Build scenario-based budgets that include parts arrival timing and scheduling reserves for access constraints.
Then track planned versus unplanned work during non-shutdown periods. This helps you adjust assumptions before the next 2026 window closes.
What preventive maintenance costs are normal for older assets versus newer ones?
Older assets often require more inspection scope and may produce more findings that need corrective follow-through. Parts complexity can also increase, especially when components are harder to source or require more verification.
Newer assets can start with simpler checklists and lower parts variability. Even then, you should revisit your plan as real job results accumulate, because early assumptions rarely stay perfect.
Preventive maintenance costs are forecastable when scope and execution are disciplined
Preventive maintenance costs are not a mystery cost line. They become forecastable when you define scope, map intervals to your assets, and plan for realistic execution constraints. The totals will still vary, but you can explain why they vary and manage the drivers.
Use a repeatable method for 2026 planning. Start with inventory, set strategy by criticality, estimate labor and parts, and schedule around shutdown and permit realities. Then track planned versus unplanned work so you can see whether preventive spending reduces corrective load.
Finally, validate assumptions against execution evidence. Review job completion rate, checklist adherence, and recurring findings. If costs drift, adjust the interval and task scope through the performance feedback loop rather than guessing.
If you are building or improving a maintenance plan for vehicles, you can also standardize service steps and documentation. That discipline supports more accurate estimates and better comparisons between cycles. For example, a team might standardize a same-day tune-up checklist for consistent inspections, or rely on comprehensive auto repair services to keep service history complete.
To strengthen consistency across techs, many teams add mechanic shop maintenance support. Over time, that makes your preventive maintenance costs easier to forecast and easier to defend to stakeholders.
External sources
U.S. Department of Energy Reliability — guidance on maintenance planning concepts and reliability best practices for facilities.
ISO 55000 Asset management overview — asset management principles relevant to planning maintenance and managing lifecycle risk.
EPA compliance and maintenance planning context — regulatory compliance resources that help explain why compliance activities must be distinguished in planning.
Updated September 2026